An Intro to the OE Design Summit Timelines & Mapping Exercise

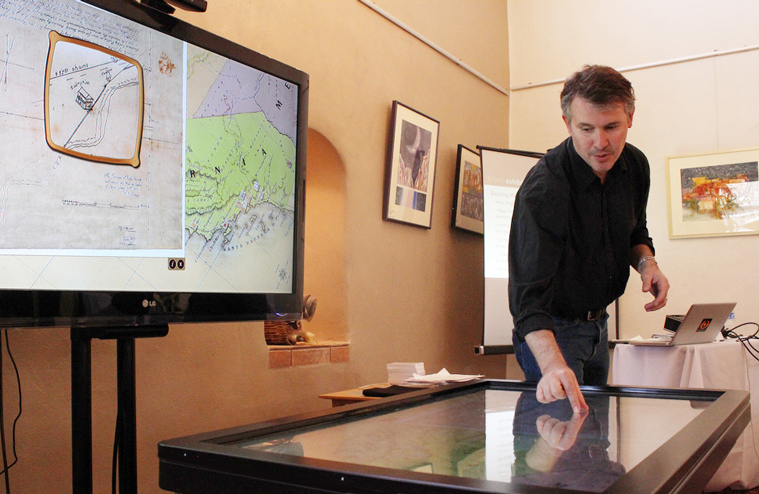
Jim Spadaccini introduced the second day’s primary activity on Timelines and Maps, briefly demonstrating use of the L.A. Zone exhibit, a part of which is displayed on an Ideum multitouch table. This application combines multiple tools to allow users to explore the Los Angeles Basin. Users benefit from a combination of KML environmental data (similar to Google Earth) overlaid with geo-spatial data, which results in a precise aerial view of the region. Using fingers to tap a specific location in Los Angeles, available Flickr photos and videos pop up, offering a close-up, ground view.
The Ideum team integrated user-friendly features such as rotating English and Spanish labels on road names and other points on the aerial map.
The direction of the maps and the control “orb” created some issues in the multi-user model. “Omni-directional mapping presents a number of challenges. We knew that once we had directionality and the orb, we were going to create a super user,” Spadaccini says. Reportedly, some users became confused or got “lost” in parts of the Los Angeles map during time spent on the table.

Summit attendee Kathleen McLean asked whether Ideum had considered expanding this regional exhibit content to the globe. Spadaccini said that Ideum had done this for a corporate client, producing a drafting table model, which made better sense for the inherent single-user interface.
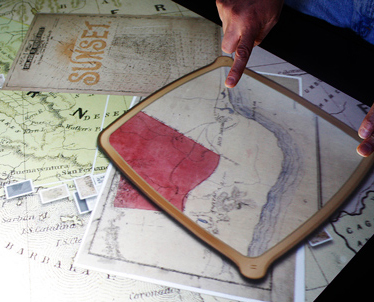
 Spadaccini demonstrated other mapping exhibits such as a recent historic mapping exhibit produced for Oakland Museum of California.
This exhibit included a dynamic digital magnifier that could be shared across the table. On a technical note concerning magnifiers, Spadaccini noted that they are currently very CPU intensive and create overlap and boundary issues.
A description of the Mapping/Timeline exhibit design activity can be viewed here:
by Sanford Clark ![]() on March 15, 2011
on March 15, 2011